How to Interpret R Squared and Goodness of Fit in Regression Analysis
Regression Analysis is a set of statistical processes that are at the core of data science. In the field of numerical simulation, it represents the most well-understood models and helps in interpreting machine learning algorithms. Their real-life applications can be seen in a wide range of domains, ranging from advertising and medical research to agricultural science and even different sports.
In linear regression models, R-squared is a goodness-fit-measure. It takes into account the strength of the relationship between the model and the dependent variable. Its convenience is measured on a scale of 0 – 100%.
Once you have a fit linear regression model, there are a few considerations that you need to address:
In this article, we will learn about R-squared (R2), its interpretation, limitations, and a few miscellaneous insights about it.
Let us first understand the fundamentals of Regression Analysis and its necessity.
Regression Analysis is a well-known statistical learning technique that allows you to examine the relationship between the independent variables (or explanatory variables) and the dependent variables (or response variables). It requires you to formulate a mathematical model that can be used to determine an estimated value which is nearly close to the actual value.
The two terms essential to understanding Regression Analysis:
Consider a situation where you are given data about a group of students on certain factors: number of hours of study per day, attendance, and scores in a particular exam. The Regression technique allows you to identify the most essential factors, the factors that can be ignored and the dependence of one factor on others.
There are mainly two objectives of a Regression Analysis technique:
The technique generates a regression equation where the relationship between the explanatory variable and the response variable is represented by the parameters of the technique.
You can use the Regression Analysis to perform the following:
Residuals identify the deviation of observed values from the expected values. They are also referred to as error or noise terms. A residual gives an insight into how good our model is against the actual value but there are no real-life representations of residual values.
.jpg)
Source: hatarilabs.com
The calculation of the real values of intercept, slope, and residual terms can be a complicated task. However, the Ordinary Least Square (OLS) regression technique can help us to speculate on an efficient model. The technique minimizes the sum of the squared residuals. With the help of the residual plots, you can check whether the observed error is consistent with the stochastic error (differences between the expected and observed values must be random and unpredictable).
The Regression Analysis is a part of the linear regression technique. It examines an equation that reduces the distance between the fitted line and all of the data points. Determining how well the model fits the data is crucial in a linear model.
A general idea is that if the deviations between the observed values and the predicted values of the linear model are small and unbiased, the model has a well-fit data.
In technical terms, “Goodness-of-fit” is a mathematical model that describes the differences between the observed values and the expected values or how well the model fits a set of observations. This measure can be used in statistical hypothesis testing.
According to statisticians, if the differences between the observations and the predicted values tend to be small and unbiased, we can say that the model fits the data well. The meaning of unbiasedness in this context is that the fitted values do not reach the extremes, i.e. too high or too low during observations.
As we have seen earlier, a linear regression model gives you the outlook of the equation which represents the minimal difference between the observed values and the predicted values. In simpler terms, we can say that linear regression identifies the smallest sum of squared residuals probable for the dataset.
Determining the residual plots represents a crucial part of a regression model and it should be performed before evaluating the numerical measures of goodness-of-fit, like R-squared. They help to recognize a biased model by identifying problematic patterns in the residual plots.
However, if you have a biased model, you cannot depend on the results. If the residual plots look good, you can assess the value of R-squared and other numerical outputs.
In data science, R-squared (R2) is referred to as the coefficient of determination or the coefficient of multiple determination in case of multiple regression.
In the linear regression model, R-squared acts as an evaluation metric to evaluate the scatter of the data points around the fitted regression line. It recognizes the percentage of variation of the dependent variable.
R-squared is the proportion of variance in the dependent variable that can be explained by the independent variable.
.jpg)
The value of R-squared stays between 0 and 100%:
If your value of R2 is large, you have a better chance of your regression model fitting the observations.
Although you can get essential insights about the regression model in this statistical measure, you should not depend on it for the complete assessment of the model. It does not give information about the relationship between the dependent and the independent variables.
It also does not inform about the quality of the regression model. Hence, as a user, you should always analyze R2 along with other variables and then derive conclusions about the regression model.
You can have a visual demonstration of the plots of fitted values by observed values in a graphical manner. It illustrates how R-squared values represent the scatter around the regression line. .jpg)
As observed in the pictures above, the value of R-squared for the regression model on the left side is 17%, and for the model on the right is 83%. In a regression model, when the variance accounts to be high, the data points tend to fall closer to the fitted regression line.
However, a regression model with an R2 of 100% is an ideal scenario which is actually not possible. In such a case, the predicted values equal the observed values and it causes all the data points to fall exactly on the regression line.
The simplest interpretation of R-squared is how well the regression model fits the observed data values. Let us take an example to understand this.
Consider a model where the R2 value is 70%. This would mean that the model explains 70% of the fitted data in the regression model. Usually, when the R2 value is high, it suggests a better fit for the model.
The correctness of the statistical measure does not only depend on R2 but can depend on other several factors like the nature of the variables, the units on which the variables are measured, etc. So, a high R-squared value is not always likely for the regression model and can indicate problems too.
A low R-squared value is a negative indicator for a model in general. However, if we consider the other factors, a low R2 value can also end up in a good predictive model.
R- squared can be evaluated using the following formula: .jpg)
Where:
The sum of squares due to regression assesses how well the model represents the fitted data and the total sum of squares measures the variability in the data used in the regression model.
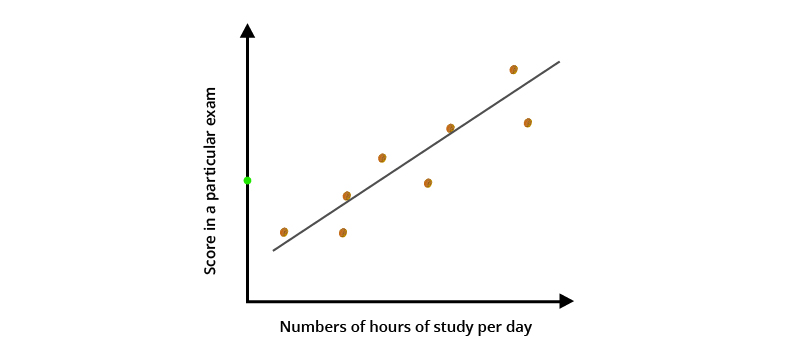
Now let us come back to the earlier situation where we have two factors: number of hours of study per day and the score in a particular exam to understand the calculation of R-squared more effectively. Here, the target variable is represented by the score and the independent variable by the number of hours of study per day.
.jpg) In this case, we will need a simple linear regression model and the equation of the model will be as follows:
In this case, we will need a simple linear regression model and the equation of the model will be as follows:
ŷ = w1x1 + b
The parameters w1 and b can be calculated by reducing the squared error over all the data points. The following equation is called the least square function:
minimize ∑(yi – w1x1i – b)2
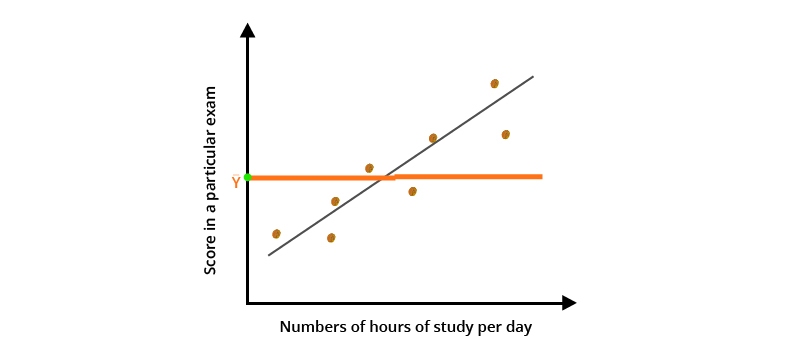
Now, to calculate the goodness-of-fit, we need to calculate the variance:
var(u) = 1/n∑(ui – ū)2
where, n represents the number of data points.
Now, R-squared calculates the amount of variance of the target variable explained by the model, i.e. function of the independent variable.
However, in order to achieve that, we need to calculate two things:
var(avg) = ∑(yi – Ӯ)2
var(model) = ∑(yi – ŷ)2
Finally, we can calculate the equation of R-squared as follows:
R2 = 1 – [var(model)/var(avg)] = 1 -[∑(yi – ŷ)2/∑(yi – Ӯ)2]
Some of the limitations of R-squared are:
To determine the biasedness of the model, you need to assess the residuals plots. A good model can have a low R-squared value whereas you can have a high R-squared value for a model that does not have proper goodness-of-fit.
Regression models with low R2 do not always pose a problem. There are some areas where you are bound to have low R2 values. One such case is when you study human behavior. They tend to have R2 values less than 50%. The reason behind this is that predicting people is a more difficult task than predicting a physical process.
You can draw essential conclusions about your model having a low R2 value when the independent variables of the model have some statistical significance. They represent the mean change in the dependent variable when the independent variable shifts by one unit.
However, if you are working on a model to generate precise predictions, low R-squared values can cause problems.
Now, let us look at the other side of the coin. A regression model with high R2 value can lead to – as the statisticians call it – specification bias. This type of situation arises when the linear model is underspecified due to missing important independent variables, polynomial terms, and interaction terms.
To overcome this situation, you can produce random residuals by adding the appropriate terms or by fitting a non-linear model.
Model overfitting and data mining techniques can also inflate the value of R2. The model they generate might provide an excellent fit to the data but actually the results tend to be completely deceptive.
Let us summarize what we have covered in this article so far:
Although R-squared is a very intuitive measure to determine how well a regression model fits a dataset, it does not narrate the complete story. If you want to get the full picture, you need to have an in-depth knowledge of R2 along with other statistical measures and residual plots.
For gaining more information on the limitations of the R-squared, you can learn about Adjusted R-squared and Predicted R-squared which provide different insights to assess a model’s goodness-of-fit. You can also take a look at a different type of goodness-of-fit measure, i.e. Standard Error of the Regression.
Research & References of How to Interpret R Squared and Goodness of Fit in Regression Analysis|A&C Accounting And Tax Services
Source
0 Comments